Amazon PPC Profit Tracking: Why I Read TACoS Product by Product
ACoS tells you what your ads cost against the sales they claim. It can’t tell you whether the business made money, and it can’t tell you whether a number is a problem or a plan.
I like TACoS (ad spend against all of a product’s sales, ads and organic), but a lot of my decisions are based on where a product is in its life, and on whatever else is going on with it that month.
The short version
- ACoS shows what ads cost against the sales they claim; it can't show whether the business made money or whether a number is a problem or a plan.
- I track profit after ads per product, TACoS per product by month, and break-even ACoS per product.
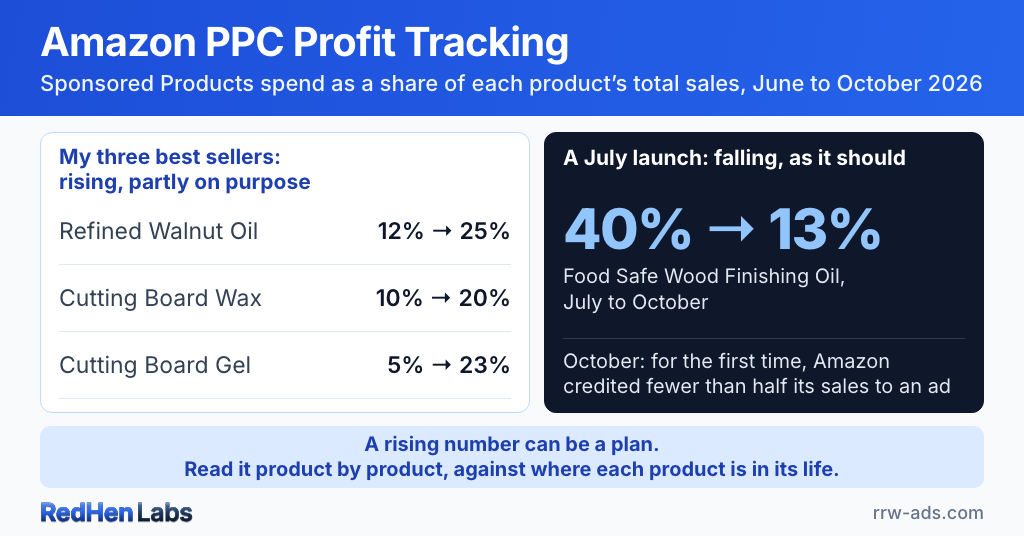
- From June to October 2026, Sponsored Products spend on my three best sellers rose from 5–12% of their total sales to 20–25%: partly the season, partly a holiday push I chose.
- A newer product went the other way: my Food Safe Wood Finishing Oil fell from 40% in its first month to 13% by October.
- Things ACoS can't see, like losing the Buy Box, low stock or a price change, decide what the right bid is.
Five months of my numbers
Here’s Sponsored Products spend as a share of each product’s total sales, by month, on my US account:
| Product | Jun | Jul | Aug | Sep | Oct |
|---|---|---|---|---|---|
| Refined Walnut Oil | 12% | 16% | 23% | 20% | 25% |
| Cutting Board Wax | 10% | 10% | 12% | 20% | 20% |
| Cutting Board Gel | 5% | 18% | 12% | 12% | 23% |
| Food Safe Wood Finishing Oil | — | 40% | 22% | 24% | 13% |
| HardWax Oil | 1% | 4% | 8% | 7% | 3% |
Read without context, the top three look like they’re getting worse. Part of that is the season: clicks cost more as the holidays get closer. Part of it is a choice: on a few products I’m paying for more impressions on purpose, to push sales and Best Sellers Rank before the holidays. (What that costs me per click.)
The Food Safe oil went the other way: 40% in its first month, 13% by October, when Amazon credited fewer than half of its sales to an ad for the first time. That’s the direction a launch should go. (Why new products carry a higher TACoS.)
What ACoS can’t see
The same number means different things on different days. In the first week of November my gel’s ads stopped because it lost the Buy Box, not because of anything in the campaigns. (What happened that week.) Stock running low, a price change, a competitor’s coupon: none of it shows up in ACoS, and all of it changes what the right bid is.
What I check before I touch a bid
- Is the product still the featured offer, day by day? A 30-day Buy Box average hides a bad week.
- Is it in stock, and will it stay in stock for the next few weeks?
- Did the price change, mine or someone else’s?
- Where is it in its life: launching, being pushed on purpose, or mature?
- Is it above its break-even ACoS, and if so, did I choose that?
What I track
- Profit after ads, per product. What’s left after Amazon’s actual fees, product cost and ad spend.
- TACoS per product, by month, read against where the product is in its life.
- Break-even ACoS per product, so I know which line I’m choosing to cross. (Mine run 27–49%.)
What I built
RedHen Labs works out profit after ads for every product, with what Amazon actually charged. The numbers are the easy part. Knowing which ones are a plan is still my job.
A rising number can be a plan. RedHen Labs gives you the numbers to tell which.
Related reading
Do it step by step in RedHen Labs
Frequently asked questions
Can a 22% ACoS still be unprofitable?
Yes. ACoS can't see Amazon's fees or your product costs. A product whose margin after fees and costs is under 22% loses money on every ad-driven sale at a 22% ACoS. My own products break even between about 27% and 49%, so I judge each one against its own line.
What should I track to know if my Amazon ads make money?
Profit after ads for each product, from what Amazon actually charged; TACoS for each product, by month; and each product's break-even ACoS. Then read the numbers against where the product is in its life and what else changed that month.
Why does a product's TACoS change over its life?
A new product starts with few organic sales, so ad spend is a large share of its total; as reviews and rank build, organic sales grow and the share falls. My Food Safe Wood Finishing Oil went from 40% in its first month to 13% in its fourth, when Amazon credited fewer than half of its sales to an ad for the first time.
Can ACoS look fine while sales fall?
Yes. In the first week of November 2026 my cutting board gel lost the Buy Box and its Sponsored Products ads stopped serving; nothing in the campaigns' ACoS showed why my sales fell. Check the Buy Box and your stock before you change bids.
Ready to automate the right way?
RedHen Labs combines rules with AI — and keeps you in control.