TACoS vs ACoS: The KPI That Actually Reflects Your Bottom Line
I sell wood-care products on Amazon under Rowdy Rooster Woodworks — cutting board oil, hard wax oil, beeswax finishes. For most of the time I've run this brand, I watched ACoS like everyone tells you to. It's the first number on the ads dashboard: ad spend divided by ad revenue. Clean, simple — and it hid a problem on my own account for months.
Here's what ACoS is good at: telling you how efficiently a single ad converts. Here's what it can't tell you — how much your whole business leans on those ads to stand up. Two different questions. I was only asking the first one.
The short version
- ACoS is ad spend divided by ad revenue; TACoS is ad spend divided by total revenue, including organic sales. The one word 'total' is the whole difference.
- ACoS answers how efficiently a single ad converts. TACoS answers how much the whole business leans on ads to stand up.
- On the Rowdy Rooster Woodworks account, ACoS drifted from about 26% to about 35% through the spring while TACoS went from about 19% to about 25%.
- That meant ads went from roughly 19 cents of every dollar the brand booked to closer to 25 cents, while ad efficiency barely moved and nothing on the ads dashboard flagged it.
- A rising TACoS on a still-profitable account is a smoke detector rather than a fire: the ads still clear break-even, and the problem is visible while it is still small.
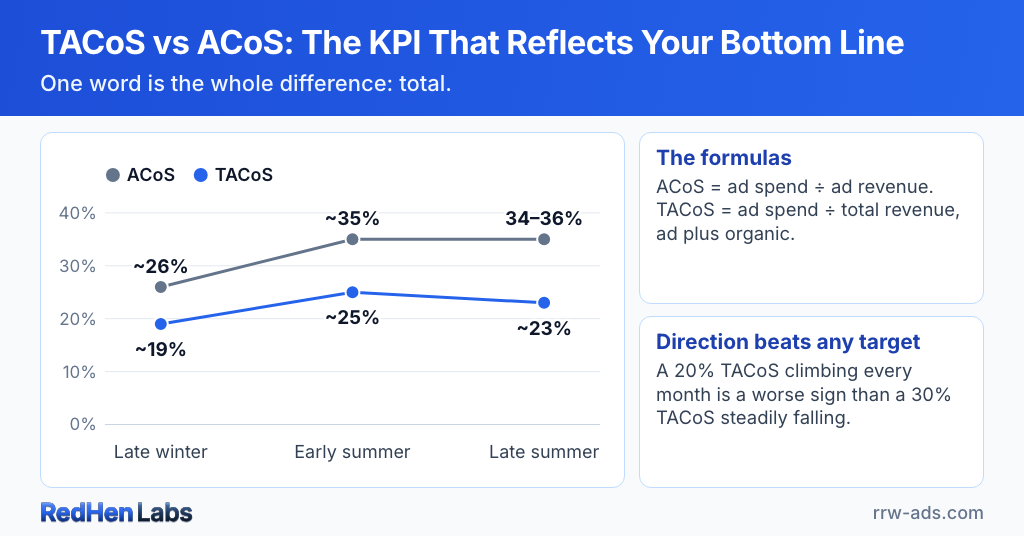
The formulas
ACoS = Ad Spend / Ad Revenue
TACoS = Ad Spend / Total Revenue (ad + organic)
One word — "total" — is the whole difference.
What ACoS hid on my own account
Through the spring my ACoS drifted from about 26% to about 35%. If you’d shown me only that, I’d have said the account was healthy — my ACoS is still inside my break-even, so the ads themselves are still making money. Nothing on the ads dashboard was flashing red.
My TACoS over that same stretch went from about 19% to about 25%. Same account, same products. In late winter, ads were about 19 cents of every dollar my brand brought in; by early summer they were closer to 25 cents. Six points does not sound like much until you notice what it is measuring — a quarter of everything my brand booked was going to advertising, and climbing, while my ad efficiency barely moved. ACoS never said a word about it.
Late winter
ACoS: ~26%
TACoS: ~19%
Early summer
ACoS: ~35%
TACoS: ~25%
Why this is a warning, not a disaster
Let me be straight about what this is and isn't. I'm still profitable. My margins are healthy and my ads still clear break-even. This isn't a fire — it's a smoke detector going off early, while the problem is still small and cheap to work on. That's the entire point of watching TACoS: it gave me months of warning that ACoS never would have. The seller who only watches ACoS doesn't find out until total sales are obviously down and they're standing in the middle of it wondering what happened.
It worked out that way, too. Through the late summer the number came back down to about 23%, while my ACoS stayed where it had been all along — between 34% and 36%, still saying nothing. What I changed in between was how much time I spent cutting wasteful search terms. I am not going to tell you I proved that one caused the other; I will tell you the number I was watching is the one that moved.
What I think is going on — and why the metric matters more than the cause
I'll be honest: I haven't fully pinned down the cause yet. My best read is that there's another seller on my brand who advertises far less aggressively than I do, sitting on top of what looks like a shift in how the Buy Box is being awarded. I'm still digging. But notice the move here — the reason I even know to dig is that TACoS flagged it. The cause is mine to solve; the lesson for you is that no amount of staring at ACoS would have surfaced it in the first place.
The Sponsored Brands catch
One more reason this is easy to miss. If multiple sellers share a listing, Sponsored Brands can complicate how you interpret ad-attributed revenue. Depending on attribution and Buy Box behavior, your ad metrics may not always reflect the revenue that ultimately lands in your own business. That's part of why I lean on TACoS: ACoS is built on ad-attributed sales, while TACoS is anchored to the real total revenue my brand actually books.
What is a good TACoS?
It's the question everyone asks, and the honest answer is that there's no universal number. What's healthy depends on where the product is in its life:
- New product launches: a higher TACoS is often expected. You're deliberately spending to buy rank and reviews before organic sales can carry the product on their own.
- Mature products: you generally want TACoS trending downward over time, as your organic base takes over more of the sales.
- Any product: the direction matters more than any target. A 20% TACoS climbing every month is a worse sign than a 30% TACoS steadily falling.
How to actually read the trend
TACoS isn't a dial you set — it's a direction you watch:
- Falling TACoS while revenue grows: your organic base is compounding. This is the goal.
- Rising TACoS while revenue is flat or slipping: that's mine right now. Investigate before it compounds.
- Rising TACoS during a launch: not always bad — sometimes you're deliberately buying rank and share, and a high TACoS is the investment. Context decides.
The metric is a flashlight, not a verdict. It tells you where to look, not what to conclude.
Yes, I build the tool that tracks this, so factor in the bias — but the metric is free and the math is Amazon's, not mine. It's why I built RedHen Labs to watch TACoS over time against real per-product profit, instead of just ACoS in a campaign report.
Here's the difference that matters. ACoS tells you whether your advertising is efficient. TACoS tells you whether your business is becoming more self-sustaining or more dependent on advertising every month. If you only watch one number, you're optimizing campaigns. If you watch both, you're managing a business.
Related reading
Frequently asked questions
What is the difference between TACoS and ACoS?
ACoS is ad spend divided by ad revenue. TACoS is ad spend divided by total revenue, meaning advertising plus organic sales. The single word 'total' is the entire difference between them. ACoS measures how efficiently one ad converts; TACoS measures how much of the whole business depends on advertising to stand up. They answer two different questions, and the ads dashboard shows only the first.
What can a healthy-looking ACoS hide?
A healthy ACoS can hide a business becoming steadily more dependent on advertising. On the Rowdy Rooster Woodworks account, ACoS drifted from about 26% to about 35% through the spring — still inside break-even, with nothing flashing red on the ads dashboard. Over the same stretch TACoS moved from about 19% to about 25%, meaning a quarter of everything the brand booked was going to advertising. ACoS never said a word about it.
Is a rising TACoS a problem?
A rising TACoS on an otherwise profitable account is a warning rather than a disaster. On the Rowdy Rooster account the margins stayed healthy and the ads still cleared break-even while TACoS climbed roughly six points. That is a smoke detector going off early, while the problem is still small enough to act on, rather than evidence that the advertising has stopped working.
Ready to automate the right way?
RedHen Labs combines rules with AI — and keeps you in control.