Amazon TACoS Tracking Software vs Basic ACoS Tracking
For four months my ACoS barely moved: 35.4%, 35.0%, 34.6%, 34.7%. Seven tenths of a percentage point across a third of a year. If ACoS were the only number I watched, I’d have concluded nothing was happening in my account.
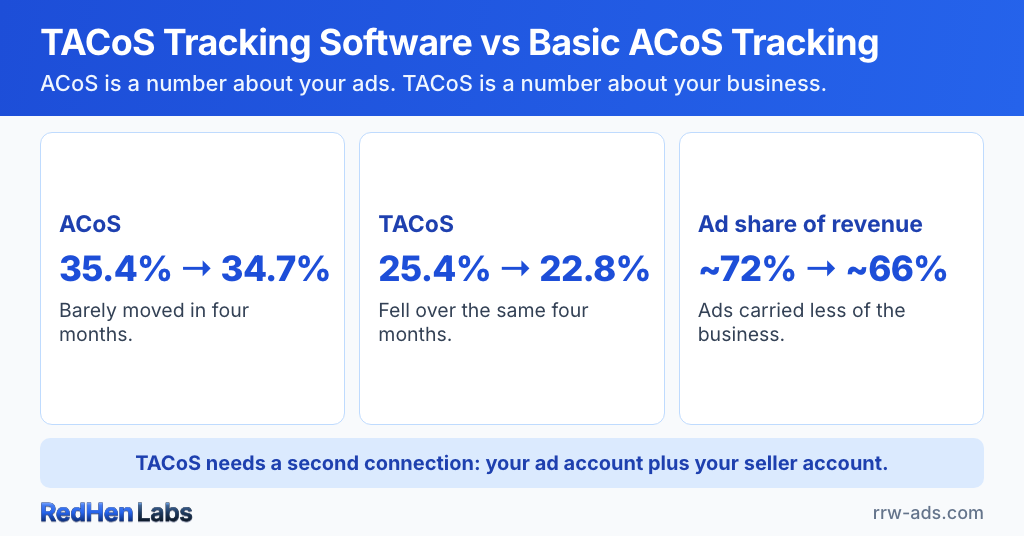
Over those same four months my TACoS fell from 25.4% to 22.8%, and the share of my revenue arriving through an ad dropped from about 72% to about 66%. Something was happening. I’d been spending more time cutting wasteful search terms, and that work showed up in TACoS while ACoS sat perfectly still.
What the two numbers measure
ACoS is ad spend divided by the revenue your ads get credit for. TACoS is the same spend divided by everything you sold — whether an ad touched it or not.
ACoS is a number about your ads. TACoS is a number about your business.
Why TACoS gets tracked less
It isn’t a harder formula. It’s a second connection.
Both halves of ACoS live in your advertising account. TACoS needs two sources: ad spend from advertising, and total revenue from your seller account — every order, including the ones no ad was involved in. That extra data source is the important difference, and it’s why TACoS isn’t as universal as ACoS.
What you can see once both are connected
TACoS becomes arithmetic, and so does the number I actually watch: the split between what advertising brought in and what came in on its own. That share is what told me the search-term work was worth the hours — ads went from carrying about 72% of revenue to about 66%, while my ad efficiency didn’t move at all.
How I read it
TACoS is a slow number and I treat it like one. I have never changed a bid because of it. It moves on the timescale organic rank moves on.
What I watch is direction over a quarter. Falling TACoS with steady revenue tells me ads are carrying less of the business. Rising TACoS tells me they’re carrying more — that I’m renting sales I used to own. If ACoS hasn’t improved while TACoS has, I start looking at what’s happening outside the attributed ad sale.
Mine drifted up through the spring, from about 19% to about 25%, and ACoS never flinched. What brought it back down was search-term work, not a bid change.
What we built
RedHen Labs connects to both your advertising and your seller account, so TACoS sits on the dashboard next to ACoS with the previous period beside it, and the advertising-versus-organic split underneath. Computed from your actual orders rather than inferred from the gap between sessions and clicks.
Having order data and ad data in the same place is also what makes profit-based bid decisions possible — a bid can answer to margin instead of to ad efficiency alone.
For what the number should actually be, and how to read a TACoS trend on a new product versus a mature one, the TACoS vs ACoS breakdown covers the strategy side.
Track the number that reflects the business rather than the ad account. See RedHen Labs pricing — a flat monthly fee, never a percentage of your ad spend.
Frequently asked questions
Why is my TACoS lower than my ACoS?
Because TACoS is divided by a bigger number. ACoS only counts the revenue your ads get credit for; TACoS counts everything you sold, including orders no ad was involved in. Any product with meaningful organic sales will show a TACoS below its ACoS, and the gap between the two is a rough read on how much of the business is standing on its own. On my account the two ran about twelve points apart through the summer.
Can I track TACoS without connecting my seller account?
Not accurately. Ad spend comes from your advertising account, but total revenue — the denominator — lives with your orders. Without that second connection the best anyone can do is infer organic sales from the gap between sessions and ad clicks, and an estimate carrying a few points of error cannot see a three-point move over a quarter, which is exactly the kind of move worth acting on.
How often should I check TACoS?
Monthly is plenty, and I would not go more often than weekly. TACoS moves on the timescale organic rank moves on, so a daily reading is mostly noise. I have never changed a bid because of TACoS. What I look at is the direction across a quarter.
What does it mean if ACoS is flat but TACoS is falling?
It means advertising is carrying less of the business than it was, while the ads themselves are running about as efficiently as before. That happened to me across four months: ACoS held between 34.6% and 35.4% while TACoS fell from 25.4% to 22.8%. When ACoS has not improved and TACoS has, the thing that changed is outside the attributed ad sale, so that is where I start looking.
Related reading
Ready to automate the right way?
RedHen Labs combines rules with AI — and keeps you in control.