How to read your Amazon P&L dashboard
What each part of the RedHen Labs dashboard shows: sales, profit, TACoS, ads and listing health, the P&L cards and product profit, and how to enter costs.
The Dashboard shows how your Amazon business is doing in one place: sales, profit after every cost, advertising, traffic and listing health, and a profit and loss statement for set periods. Profit is only as right as your product costs, so this guide ends with how to enter them.
It goes through the page top to bottom, with a screenshot of each part (what to look at is ringed and numbered). It takes about six minutes.
Step 1 · Open the Dashboard and pick the dates
In the side menu, click Dashboard. The date range (1) sets the cards and the chart: the last 7, 14, 30, 60 or 90 days, year to date, or dates of your own. Each preset ends yesterday, on Amazon's calendar for your marketplace. The marketplace switcher at the top right of the screen picks the marketplace; each is shown in its own currency and never added to another. Yesterday's profit (2) gives yesterday's profit with its sales, ad spend and costs, against the same day last week.

Step 2 · Read Business Health
Total Sales (1) is everything ordered in the period, by order day, before refunds and fees. Net Profit (2) is what's left after every cost (step 6 lists them). Units Sold counts the units ordered, and TACoS (3) is your ad spend as a share of total sales. Each card compares the period with the one just before it, of the same length: the percentage under the figure. Hover over a card to see the earlier figure.

Step 3 · Read Advertising and Traffic
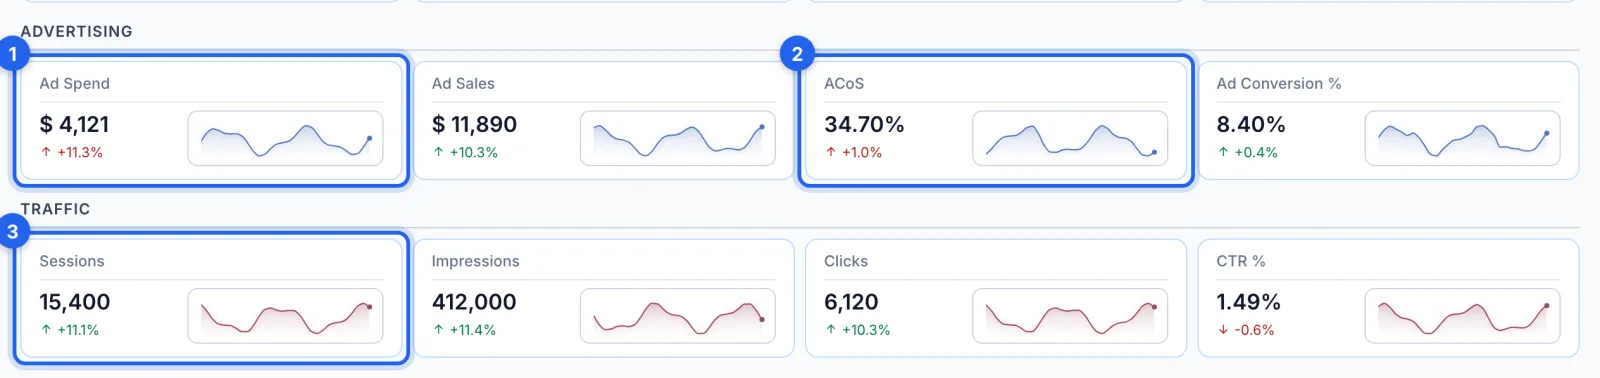
Ad Spend (1), Ad Sales, ACoS (2) and Ad Conversion % cover Sponsored Products, Sponsored Brands and Sponsored Display together. Sessions (3) counts visits to your listings from anywhere, ads or not; Impressions, Clicks and CTR % come from your ads.
Step 4 · Check your listing health
Buy Box % (1) is Amazon's share of your page views where your offer held the Buy Box. Listing Conversion % is units ordered per session, and Refund Rate % (2) is units refunded as a share of units ordered. Review Requests (3) shows the requests sent this week and today, and how your sales split between organic and paid. The traffic cards appear once Amazon's traffic data has arrived; when part of the period is missing, they say how many days they cover.

Step 5 · Compare over time
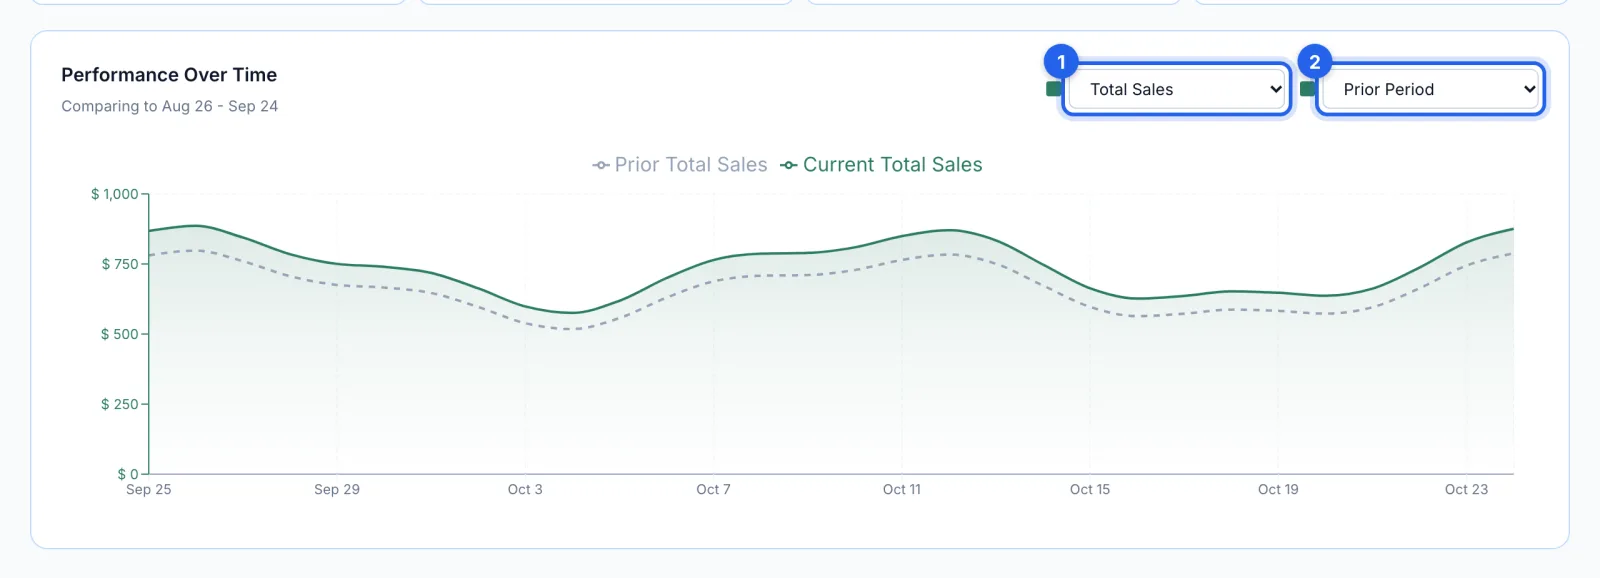
Performance Over Time draws one measure across the period, Total Sales to start, against the same days of the period before it (the dashed line). Pick a different measure (1), from 16 including Net Profit, TACoS and RoAS, or swap the comparison (2) for a second measure on its own scale.
Step 6 · Read the Profit & Loss cards
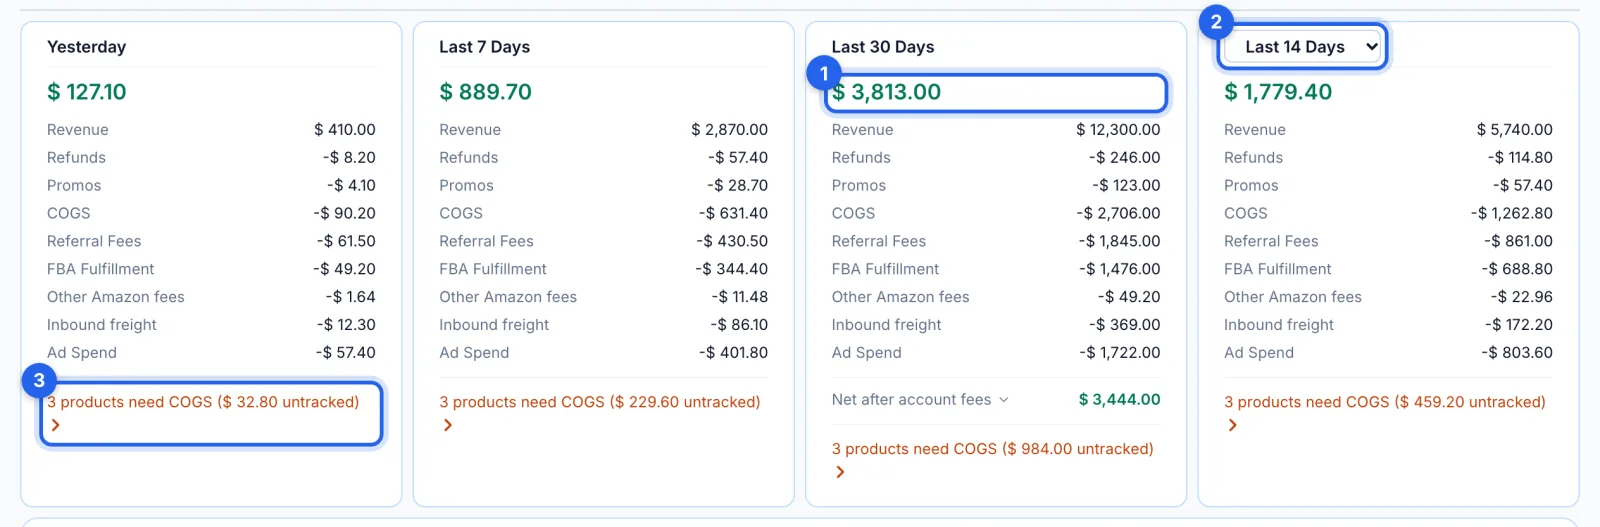
Profit & Loss shows yesterday, the last 7 and 30 days, and a period you choose (2). Each card starts from Revenue and takes out refunds and promotions (when there are any), COGS, referral fees, FBA fulfillment, other Amazon fees, inbound freight and ad spend, leaving the profit at the top (1): green, or red for a loss. Fees are Amazon's actual charges once Amazon has billed them, and an estimate until then. These cards keep their own dates; the date range at the top doesn't change them. On periods of 28 days or more, Net after account fees also takes out account-level fees such as storage and the selling subscription. A line under a card (3) says how many products have no cost entered.
Step 7 · See which products make money
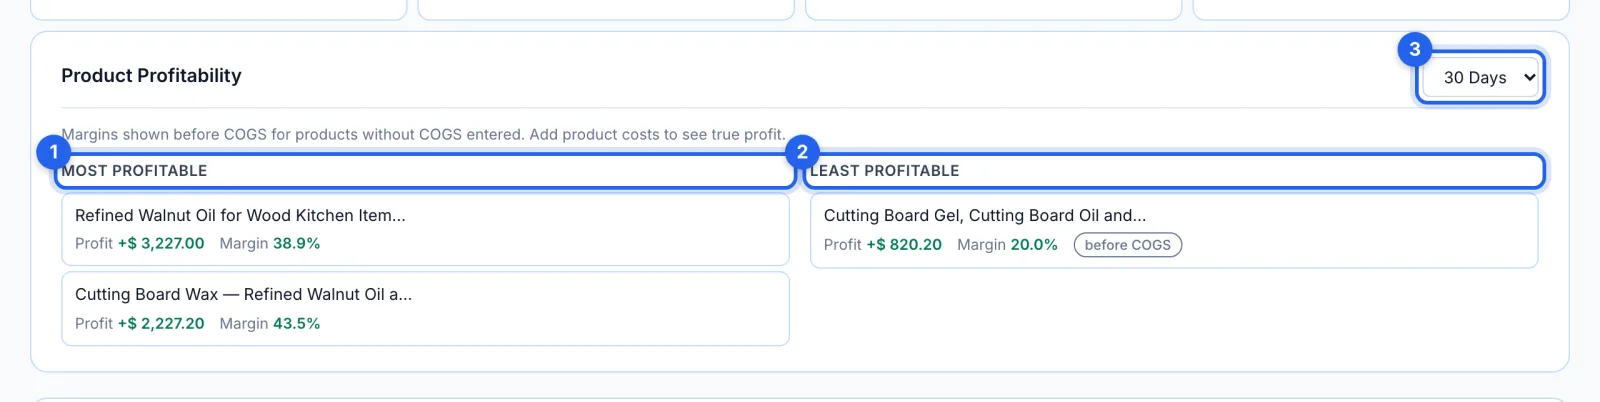
Product Profitability lists your most profitable (1) and least profitable (2) products for the period you pick (3), with each one's profit after ad spend and its margin. A product marked before COGS has no cost entered yet, so its profit reads too high. It needs an Amazon Ads connection, and the full table is on the Products page.
Step 8 · Enter your product costs
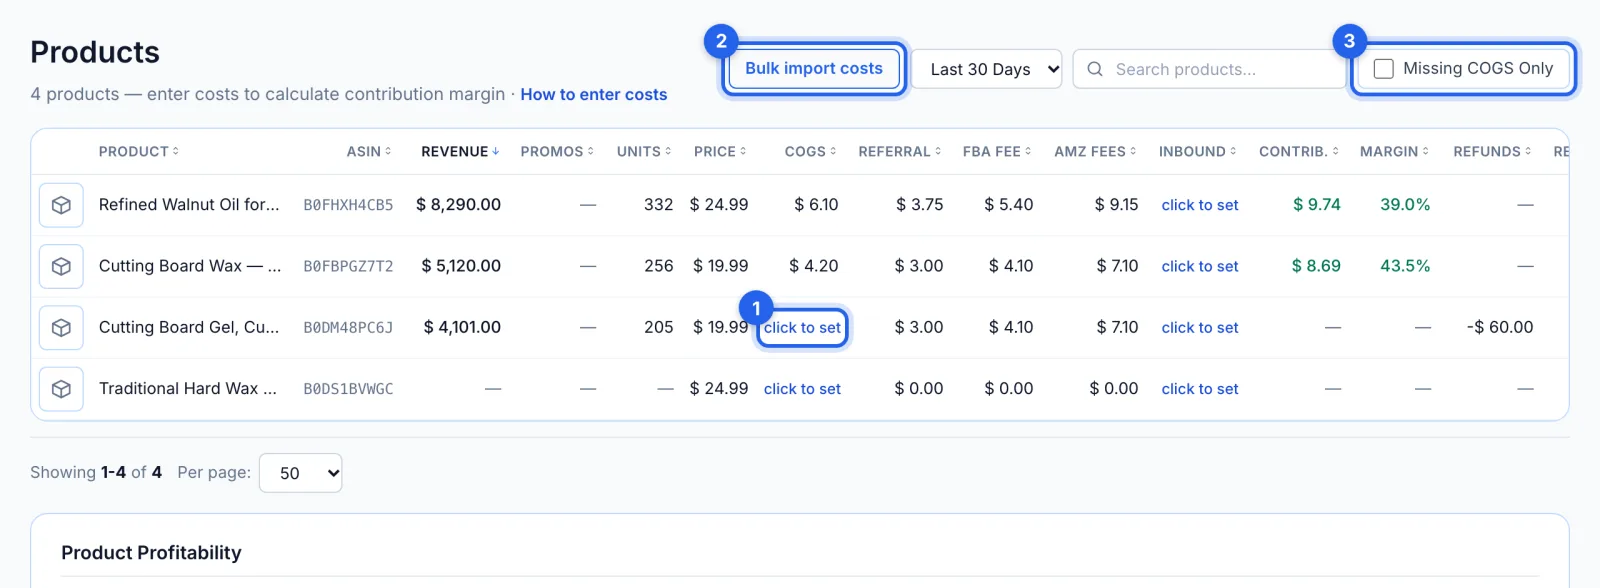
A product without a cost counts as $0 of COGS, so its profit reads too high. On the Products page (side menu, Products), click to set (1) in the COGS or Inbound column and type the cost per unit; the same goes for the FBA fee where Amazon doesn't supply one. Bulk import costs (2) takes a CSV or Excel file of up to 5,000 rows, by ASIN or SKU, and offers a sheet of your products to fill in. Missing COGS Only (3) lists the products still without a cost.
Step 9 · Change a cost the right way
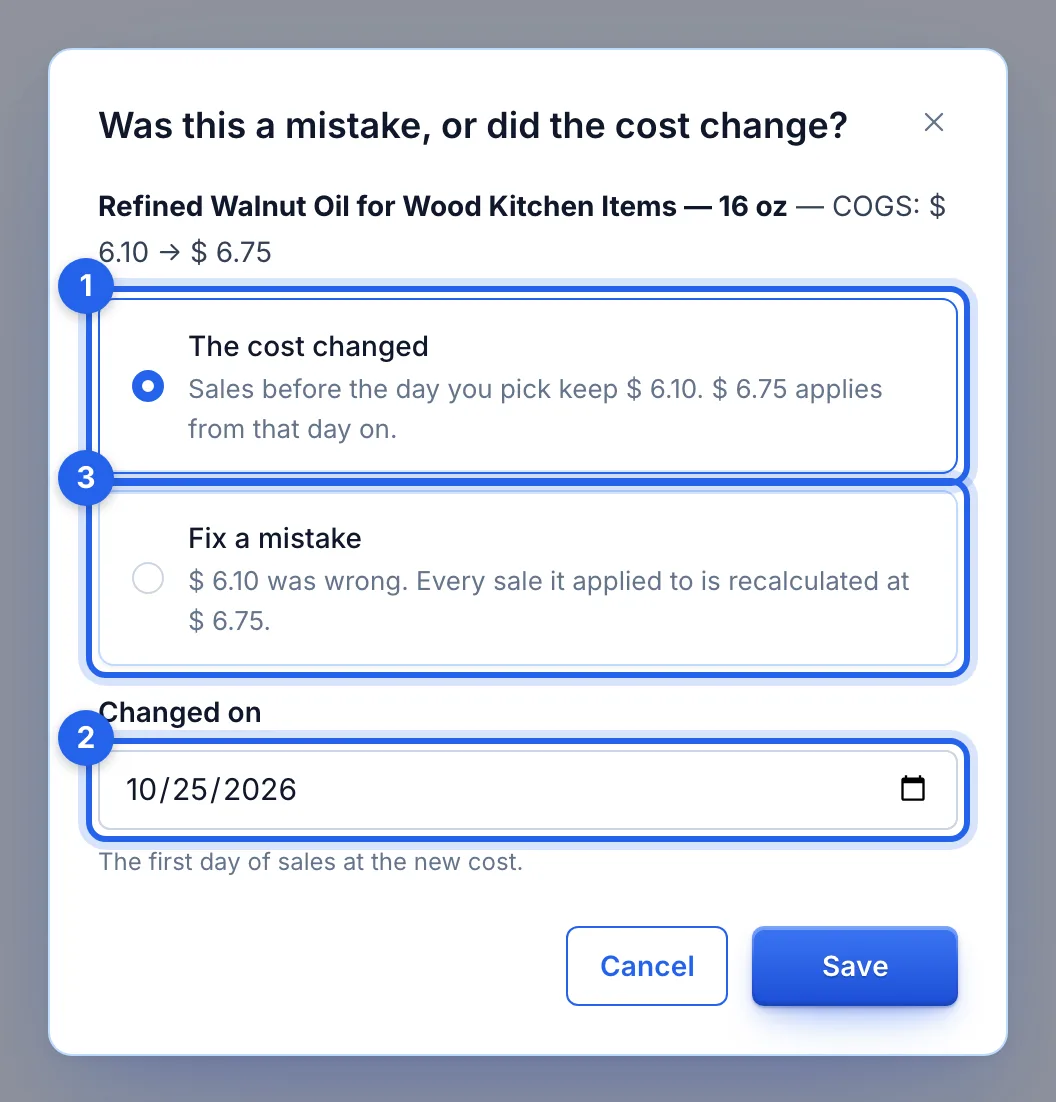
When you change a cost, you're asked whether the cost changed (1) or you're fixing a mistake (3). The cost changed keeps earlier sales at the old cost and applies the new one from the day you pick (2); Fix a mistake recalculates every sale at the new cost. Each sale is charged the cost in force on its own day, and a product with more than one cost shows its cost history. A first cost doesn't ask, and a bulk import counts as a fix.
Good to know
- When the numbers update. Amazon's sales, orders and ad reports sync overnight, which is why the presets end yesterday. Refunds are counted on the day Amazon posted them. With Amazon Ads connected, a badge beside the dates says when your reports last arrived; hover over it to see each report.
- Without Amazon Ads. With only Seller Central connected (on the Review plan, for example), the dashboard shows sales, profit and listing health, with ad spend at $0 in the P&L. Connect Amazon Ads in Settings to add the advertising figures, Yesterday's profit and Product Profitability.
- When costs can't be read. Profit shows as unavailable rather than a wrong number; refresh the page to try again.
Tips
- Enter costs for your best sellers first: they move the profit figure most.
- Watch TACoS beside ACoS. ACoS judges your ads on ad sales alone and TACoS on all your sales, so a falling TACoS means your organic sales are growing.
- Products losing money in Product Profitability are where Insights pays off first.